Reimagining income tax estimation in QuickBooks to boost confidence in tax literacy
PROJECT BACKGROUND
Members
Alvin Tran: Primary designer
Michelle Ismail: Design partner
Smitha Papolu: Design manager
James Theisen: Content designer
Chelsia Tong & Katie Shields: Project manager
Tasks
Customer research, product audit, prototyping & wireframe, UI design, micro-interaction, development hand-off, usability testing
Duration
6 months
1 in 3
QuickBooks companies are self-employed
1,200,000
Self-employed users
Self-employment is a mindset who see themselves as the business. Self-employed individuals spend their time thinking about how to achieve financial stability and taxes and IRS are anxiety-inducing for them because of heavy regulation and rigid systems.
With the recent boom in self-employed businesses started fueled by the pandemic, there are more new self-employed users than ever who are filing taxes for the first time. This project help make income taxes more approachable and digestible to new and pre-existing businesses.
Hypothesis
By directly addressing this most-represented yet underserved group with gaps between their bookkeeping and income tax, it will improve retention in product and strengthen confidence of the business owner.
"I would say I'm not super knowledgeable about taxes, I probably am not getting all of my tax deductions and things like that."


Research
LEARNING GOAL
We set out to understand how users think about taxes they owe.
Do SE tax filers understand how their tax bill is calculated, and what inputs go into this calculation?
Interview, iterate, test.
Repeat.
20 interviews with self-employed participants
8 web users, 12 mobile users, QuickBooks and non-QuickBooks users
Used criteria such as new tax filers, new business owners, novice to intermediate level of tax and accounting knowledge
Rapid Iterative Testing and Evaluation [RITE]
Multiple prototype versions
AB tested
Past research review
IDENTIFYING OUR USER GROUPS
3 tax filer archetypes
“Every now and then, I’ll come [to QuickBooks] to see what’s going on. I’ve been doing my taxes since 2015, so this is quite routine.”

The Tax-Ready
Has been in business for several years, has filed taxes before and still finds value in tax page.
Feels confident tax filing ability and knowledge
Feels compelled to be in the know
Feels empowered to take action with business money
“I want to be compliant, I want to do the right things... as a newer small business owner you just don't even know what you don't know”

The Semi-Proficient
Understands basic deduction and tax laws, compiles tax documents throughout the year and meets with tax expert at the end of the year.
Feels unsure about how to maximize deductions
Feels confident about basic tax tasks
Feels nervous about having accurate numbers
“I don’t know anything about the process of filing taxes and have to figure out what it means to file taxes as an independent owner.”

The Tax Anxious
Newly in business, has never filed taxes before and hires a tax expert/accountant to manage finances.
Feels overwhelmed by the idea of taxes
Feels anxious when tax time approaches
Feels in the dark about their tax situation

PROBLEM STATEMENT
I am a self-employed tax filer
trying to get an understanding of my comprehensive tax liability
but I have no clue how to calculate how much I owe
because I’m unsure how my business income and expenses translate into my taxes due
which makes me apprehensive of tax time

“I don’t want to play around with fake numbers...for projecting deductions, that’s something I expect the software to tell me.”
– Alex G.
LEAP OF FAITH 1
Control.
If we allow users to playfully project and adjust their income and expenses, then SEs will become more knowledgeable on how those inputs affect each other and ultimately impact their tax bill
TESTED DESIGN
We tested the idea of letting users play around with adjusting their income and deduction projection amounts.
TAKEAWAYS
Rely on automation
Most SEs did not feel comfortable or confident enough to make their own projections, and preferred QB to make projections for them.
Real numbers
SEs do not want to deal with theoretical numbers when calculating their taxes.

“I don’t like thinking about something that is like actually not in my bank account ... because until it is in my bank account it doesn’t feel real to me”
– Brad M.
LEAP OF FAITH 2
Predict.
If we allow SEs to add known upcoming transactions they foresee coming in, then they can make more accurate predictions for income and expenses
TESTED DESIGN
We tested this idea of letting users add planned transactions (big holiday sale, big equipment purchase) they foresee are coming up. With this upcoming transaction added, we can provide better estimation on their tax bill.
TAKEAWAYS
Projections in books
When SEs were given the opportunity to project upcoming transactions, they expected these transaction entries to hit their books.
Real vs projected
SEs find it difficult to differentiate between projected transactions and planned transactions

“One of the main reasons why I use this software on an almost daily basis is to calculate and project my deductions and not have to do it myself.”
– Alex G.
LEAP OF FAITH 3
Interact.
SEs are interested in being hands-on with their numbers and want to see a live impact on their tax calculations
TESTED DESIGN
We tested this idea of letting users interact with their data, showing how all the pieces affect each other. We hypothesized that seeing this relationship and interaction is valuable to the user’s understanding of taxes.
TAKEAWAYS
Work output
SEs expect QB to deliver on calculations based on the categorization work they’ve done
Expected work
Most simply want QB to do the work for them and show them how it gets calculated.
Uh oh!
Wrong approach :(
We realized the more playful tools we gave customers the more confused they became on how their estimated tax bill was calculated. We decided to move away from this feature completely.

Pivot!
Transparency
Data-driven
Clarity
Pivoted our solution after the research. Our new goal became to increase transparency of the back-end calculation to strengthen SE’s perception of accuracy and usefulness.

Real problem uncovered.
-
Personal information such as tax filing status and income outside of their business significantly impacts their tax calculation, but they were not seeing how QB was factoring in these inputs.
Web Design

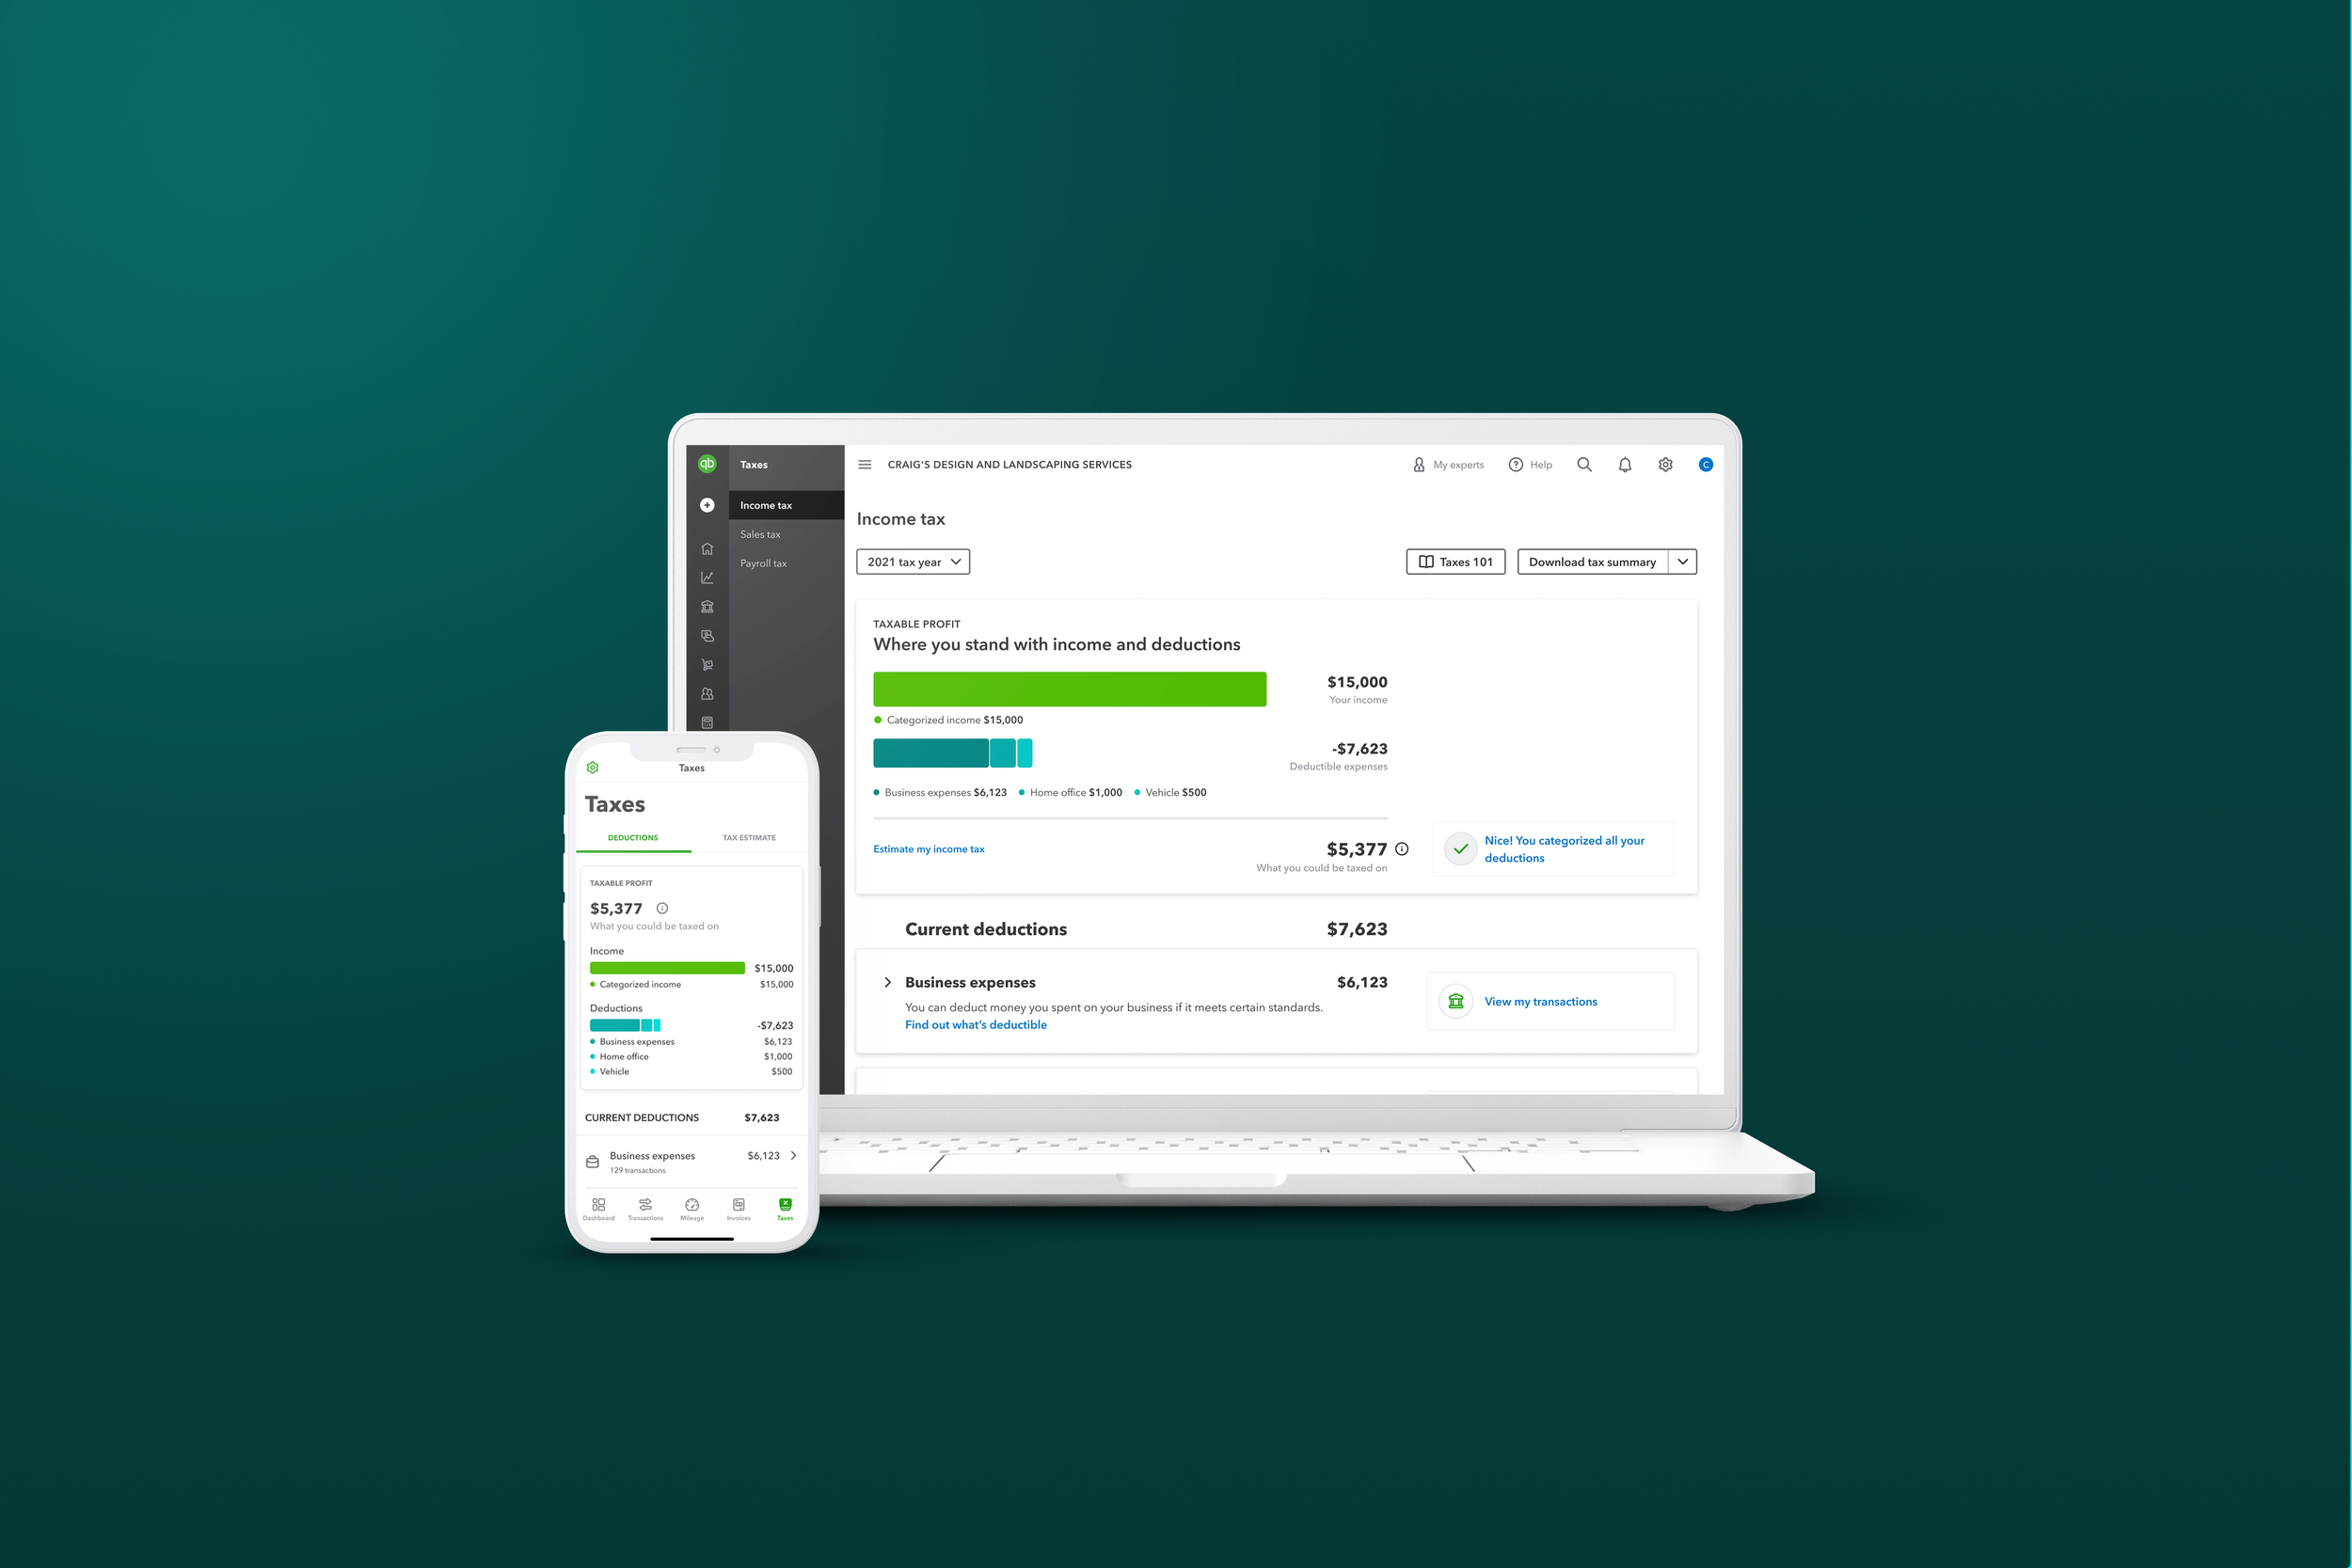
At a glance.
Highlight deduction related information to drive action and build habit loop
Bar graph
The bar graph with clearly labeled legends summarizes the proportional relationship between income and deduction amounts .
Dashed lines
The dashed lines represent transactions that still require action and the highlight the potential of what the total amount could be.
In-context CTA
The main call to action is placed within context of the data to quickly capture the user’s attention and provides a quick access point to take action.


Break it down.
Drill-downs of different deduction types summarizes where users stand with their deductions
Collapsible drill-down
The expandable cards highlights the main information at first glance and allow users to view and make edits of each category more in-depth.
CTAs at the top
Surfaced CTAs allows quick and visible access points for users to claim deductions. Content incentivizes engagement.

Accessibility focused.
Highlighting bars in the chart with their corresponding legend aid with accessibility
Highlight to delight
Sections of the data visualization and their corresponding legend are highlighted when hovered over to help with visual accessibility by highlighting and isolating the item.
Mobile Design
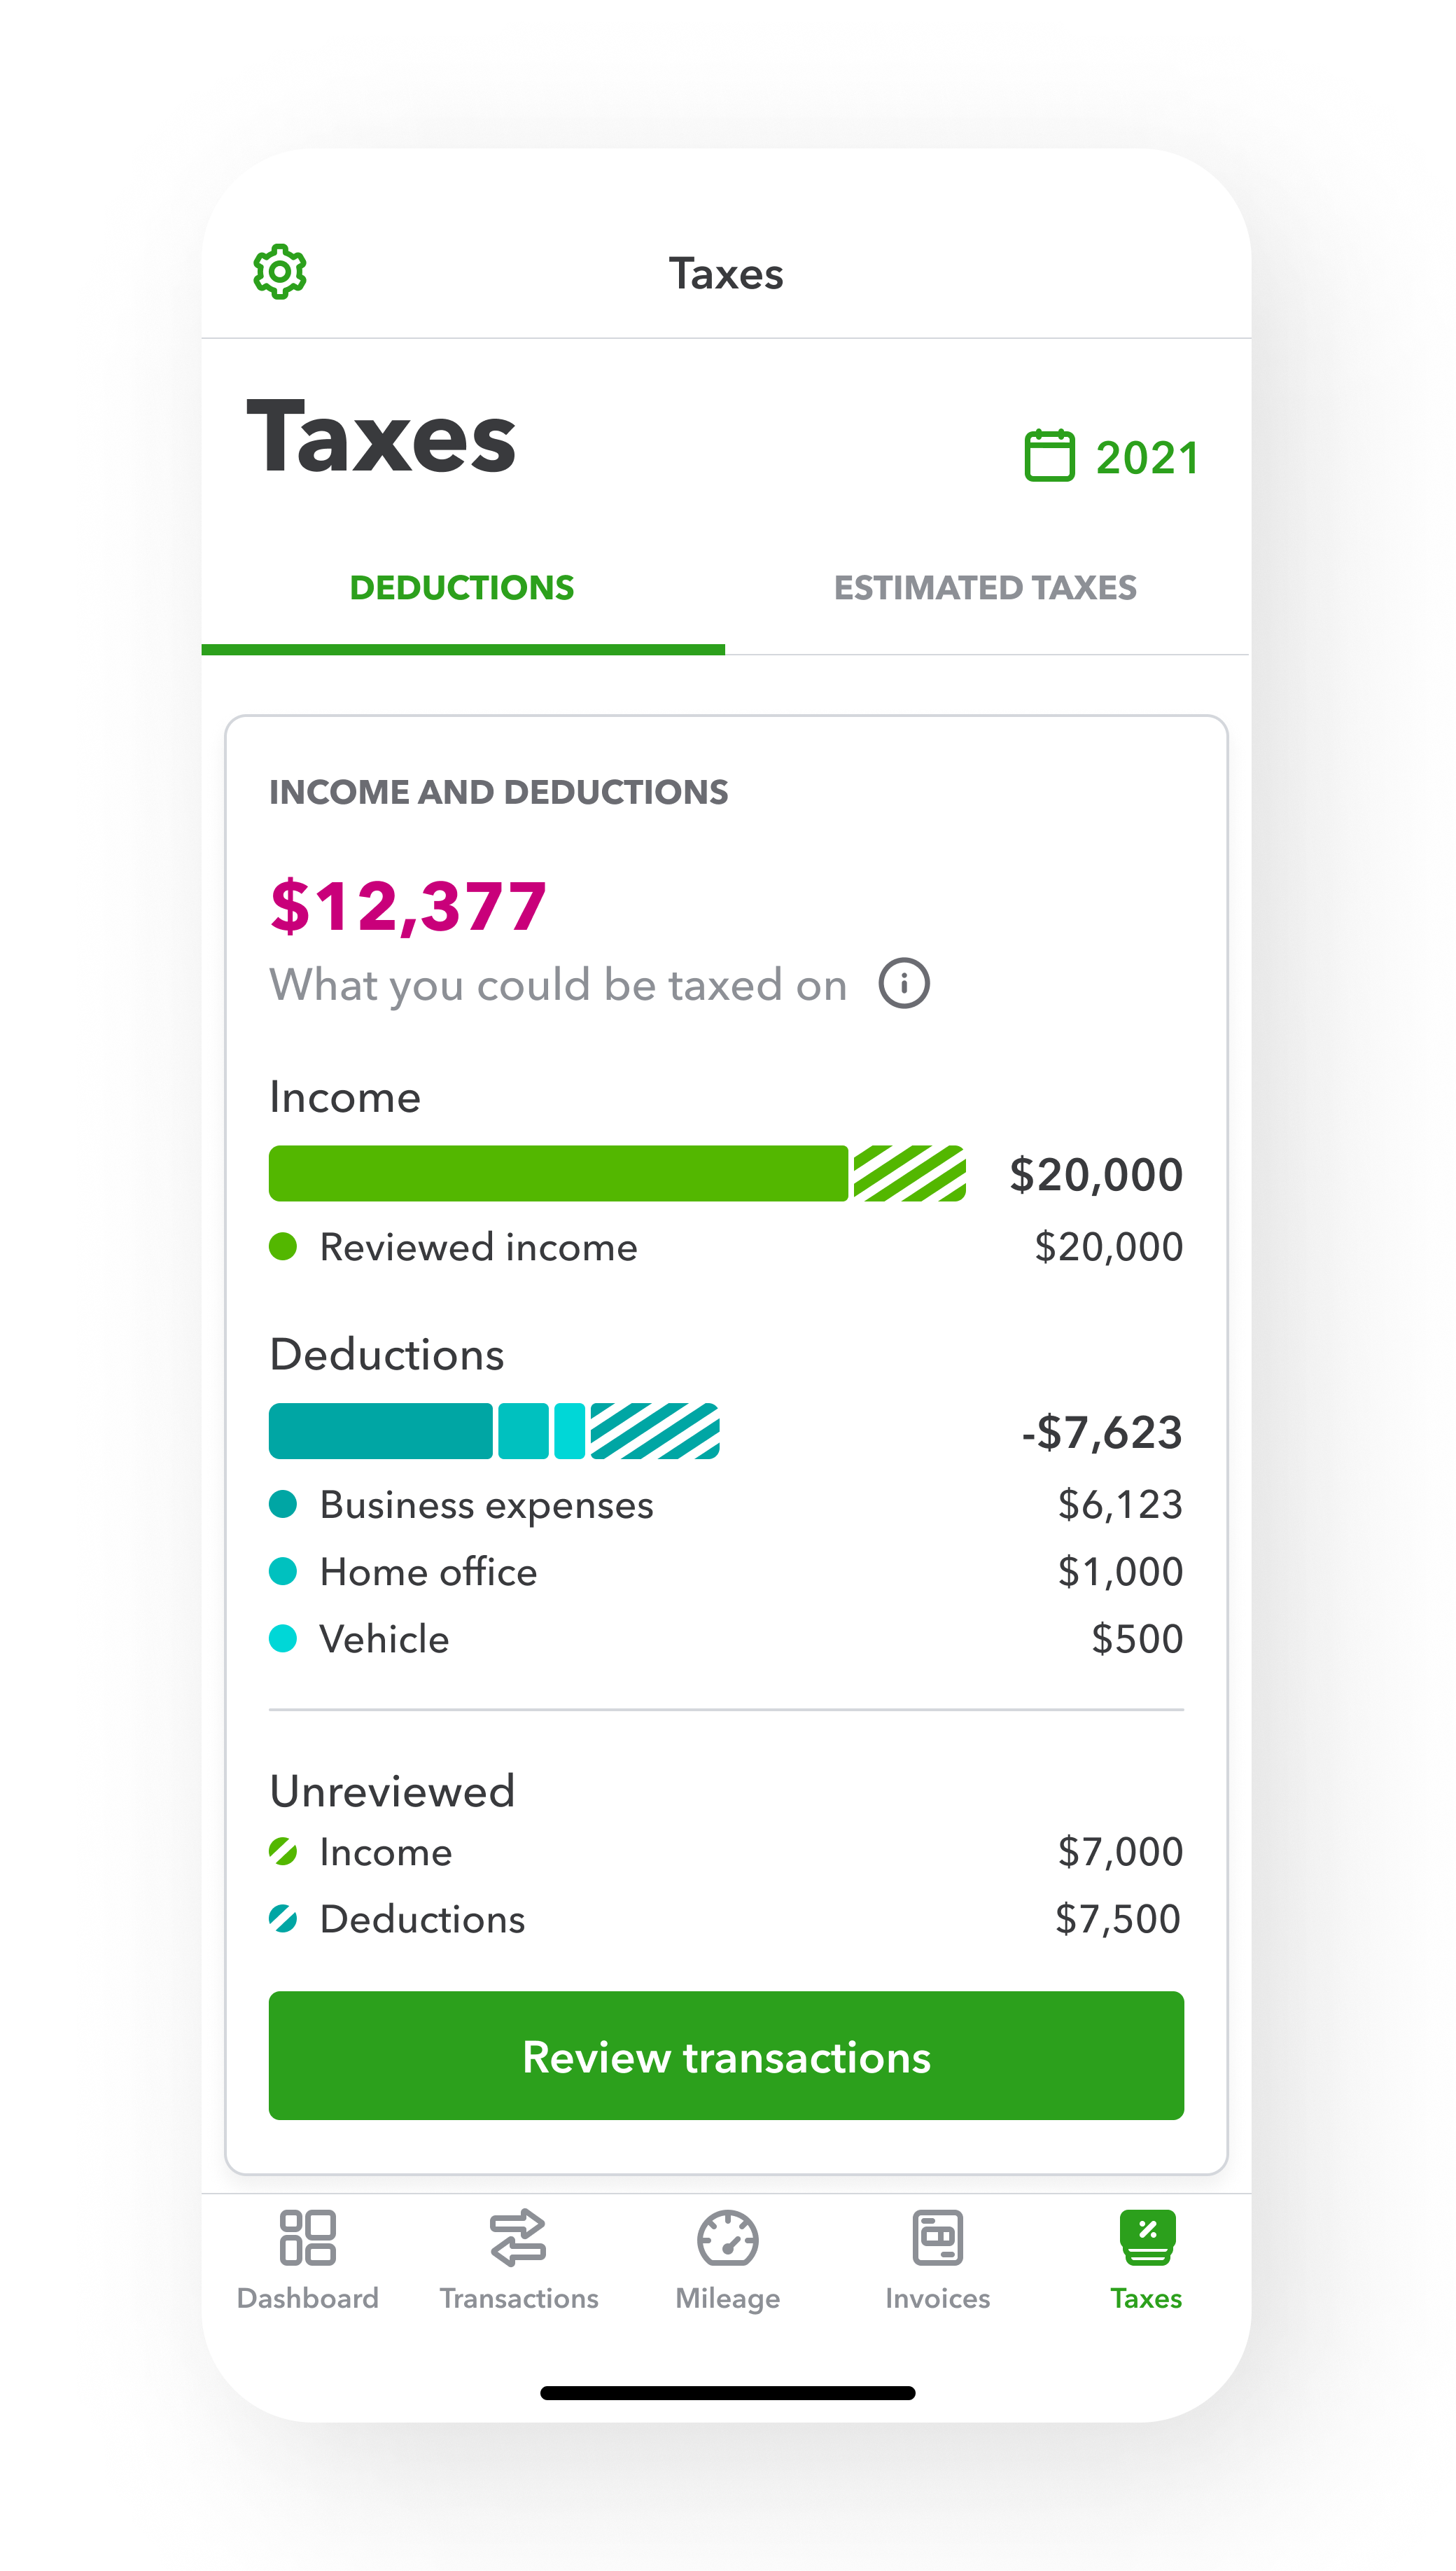
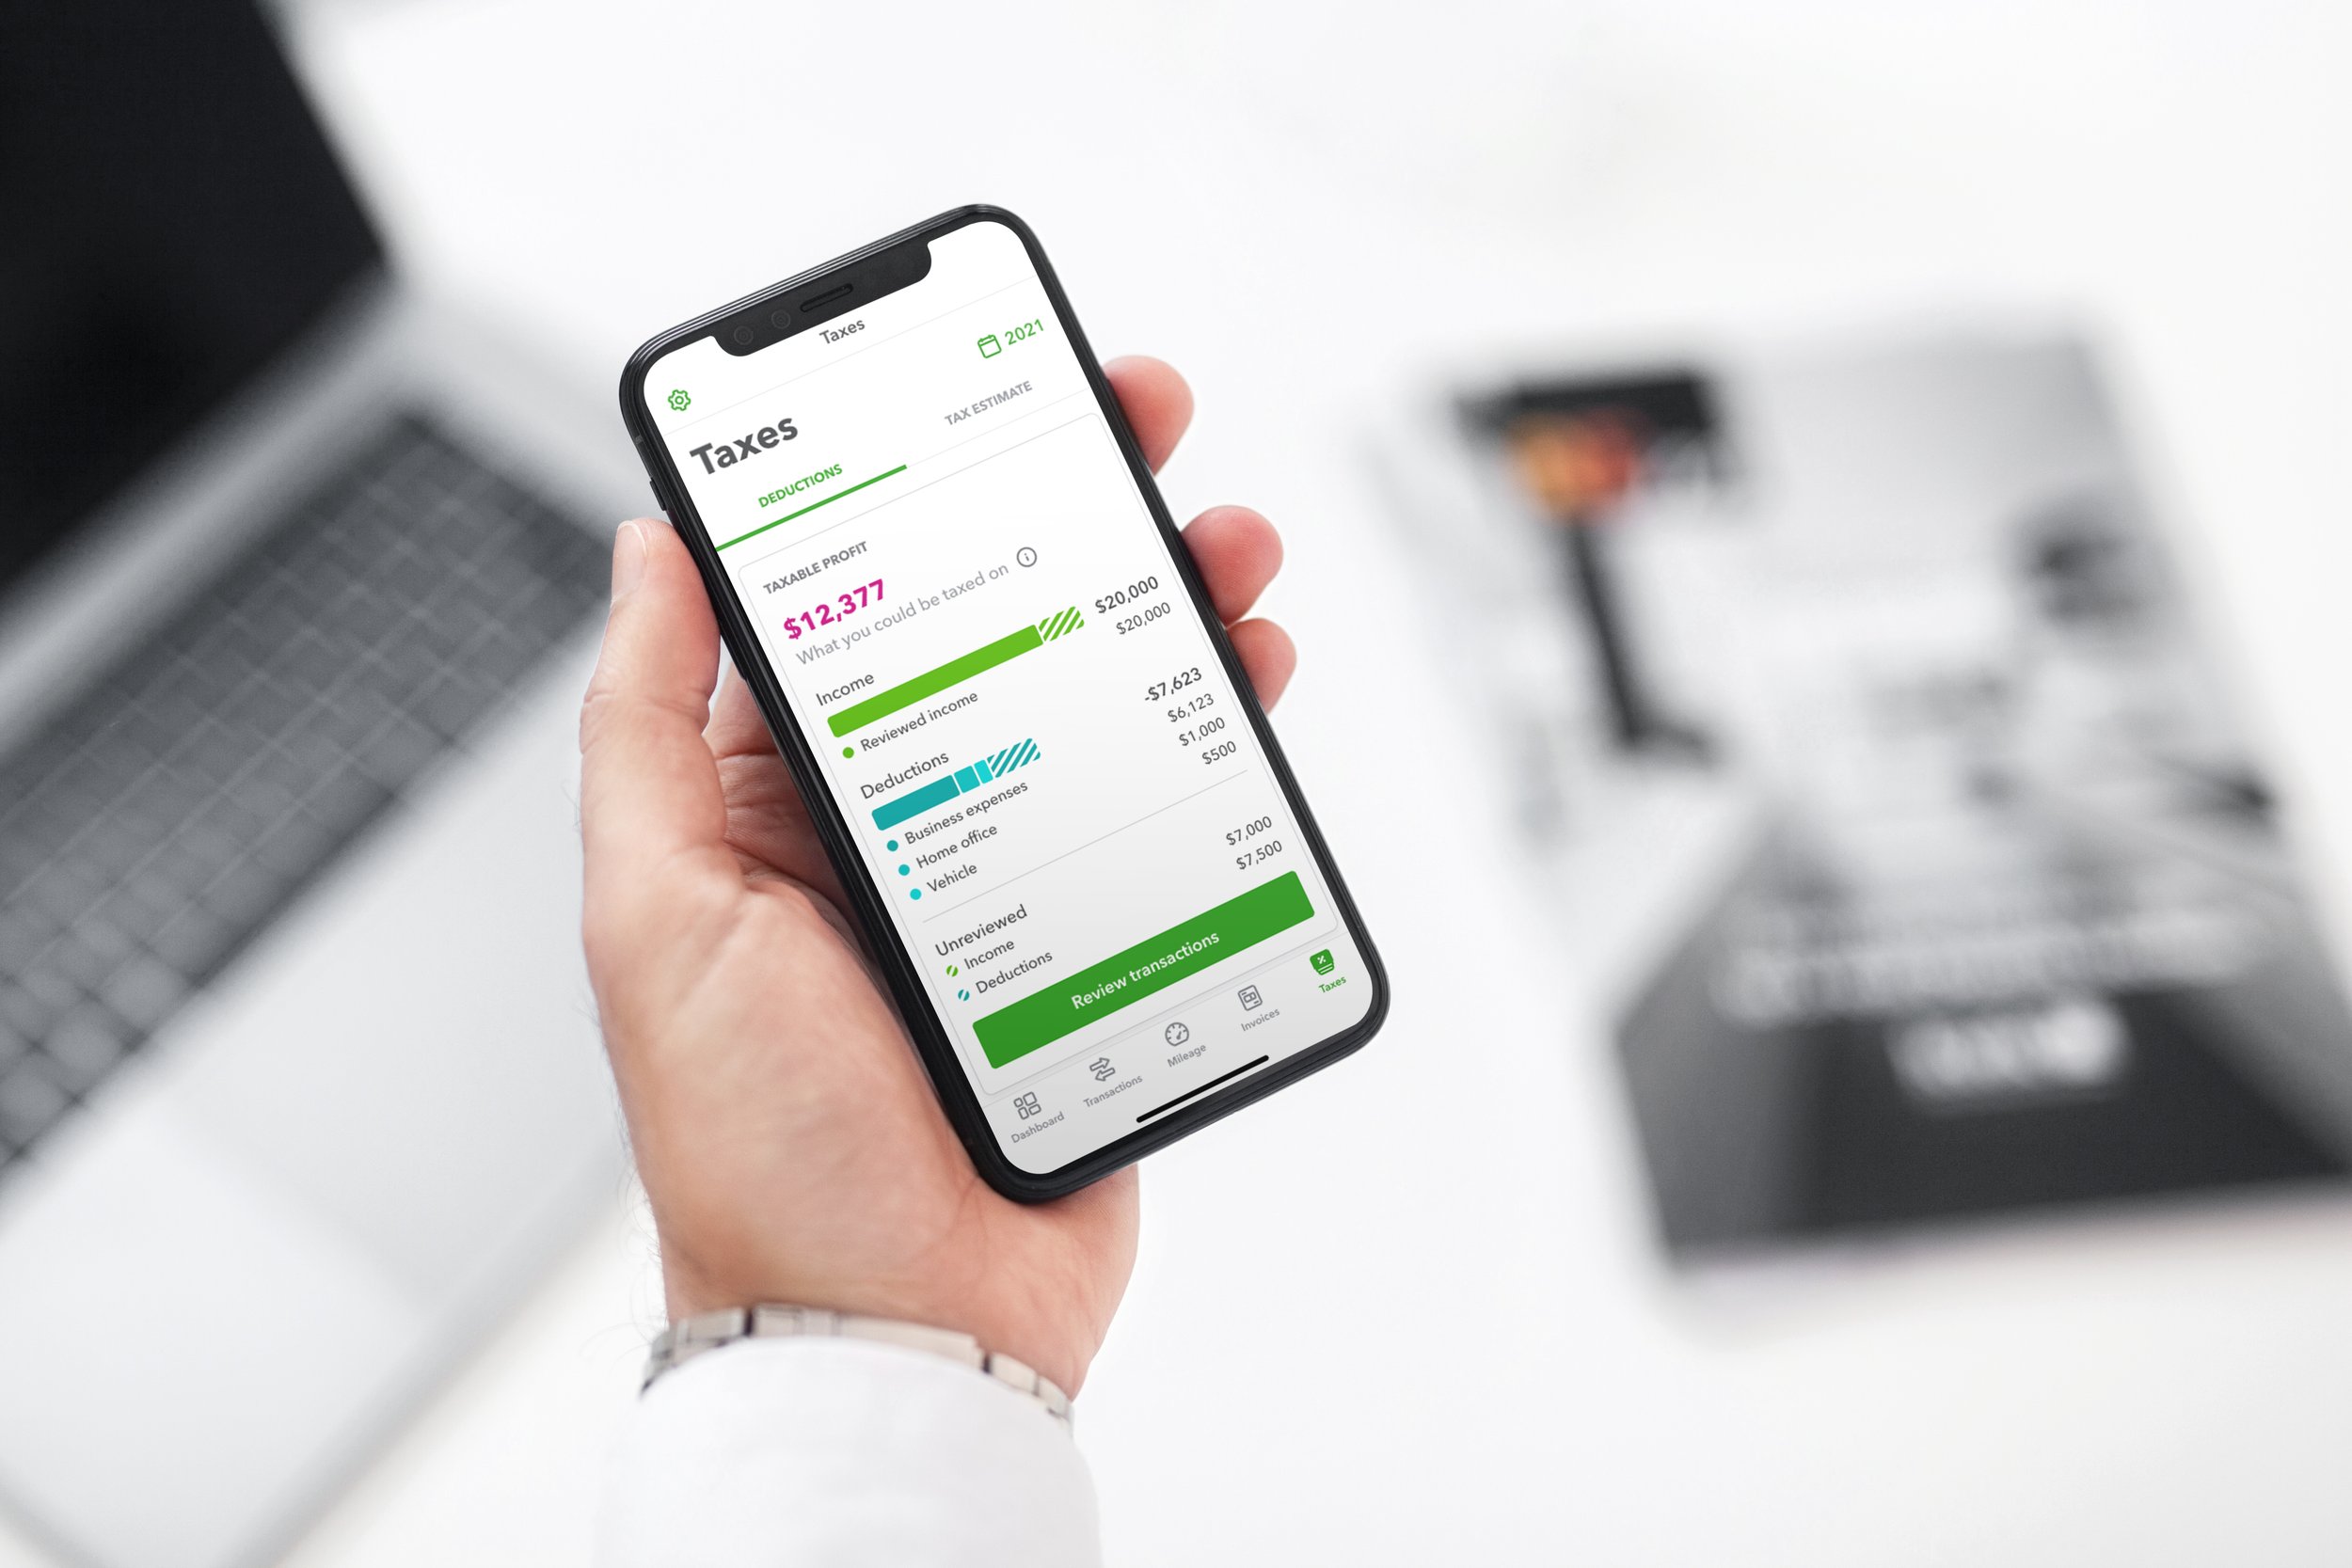
Income and deductions visualized.
Summary card showcases data visualization of where users stand with their finances
Challenge
With the limited screen space, finding an elegant solution to display all necessary components of a user’s tax history is the main challenge faced.
Solution
Stacking the data visualization bars vertically, and grouping data by income, deductions, and unreviewed items compactly maximizes information shown.
Unreviewed highlighted
Using grouping of data and proximity of the main call to action within context, it highlights to users of work that still needs to be done, and an access point to easily take action to resolve these transactions.


It’s all in the details.
Deduction detail breakdown helps keep crucial information at the top, and details to follow
Progressive disclosure
The design prioritizes showing the summary of the user’s deductions and uses a drill-down pattern to expose more information for each category to reduce cognitive and visual load.

Action. Called out.
Clear CTAs highlight top actions users can take to maximize their deductions


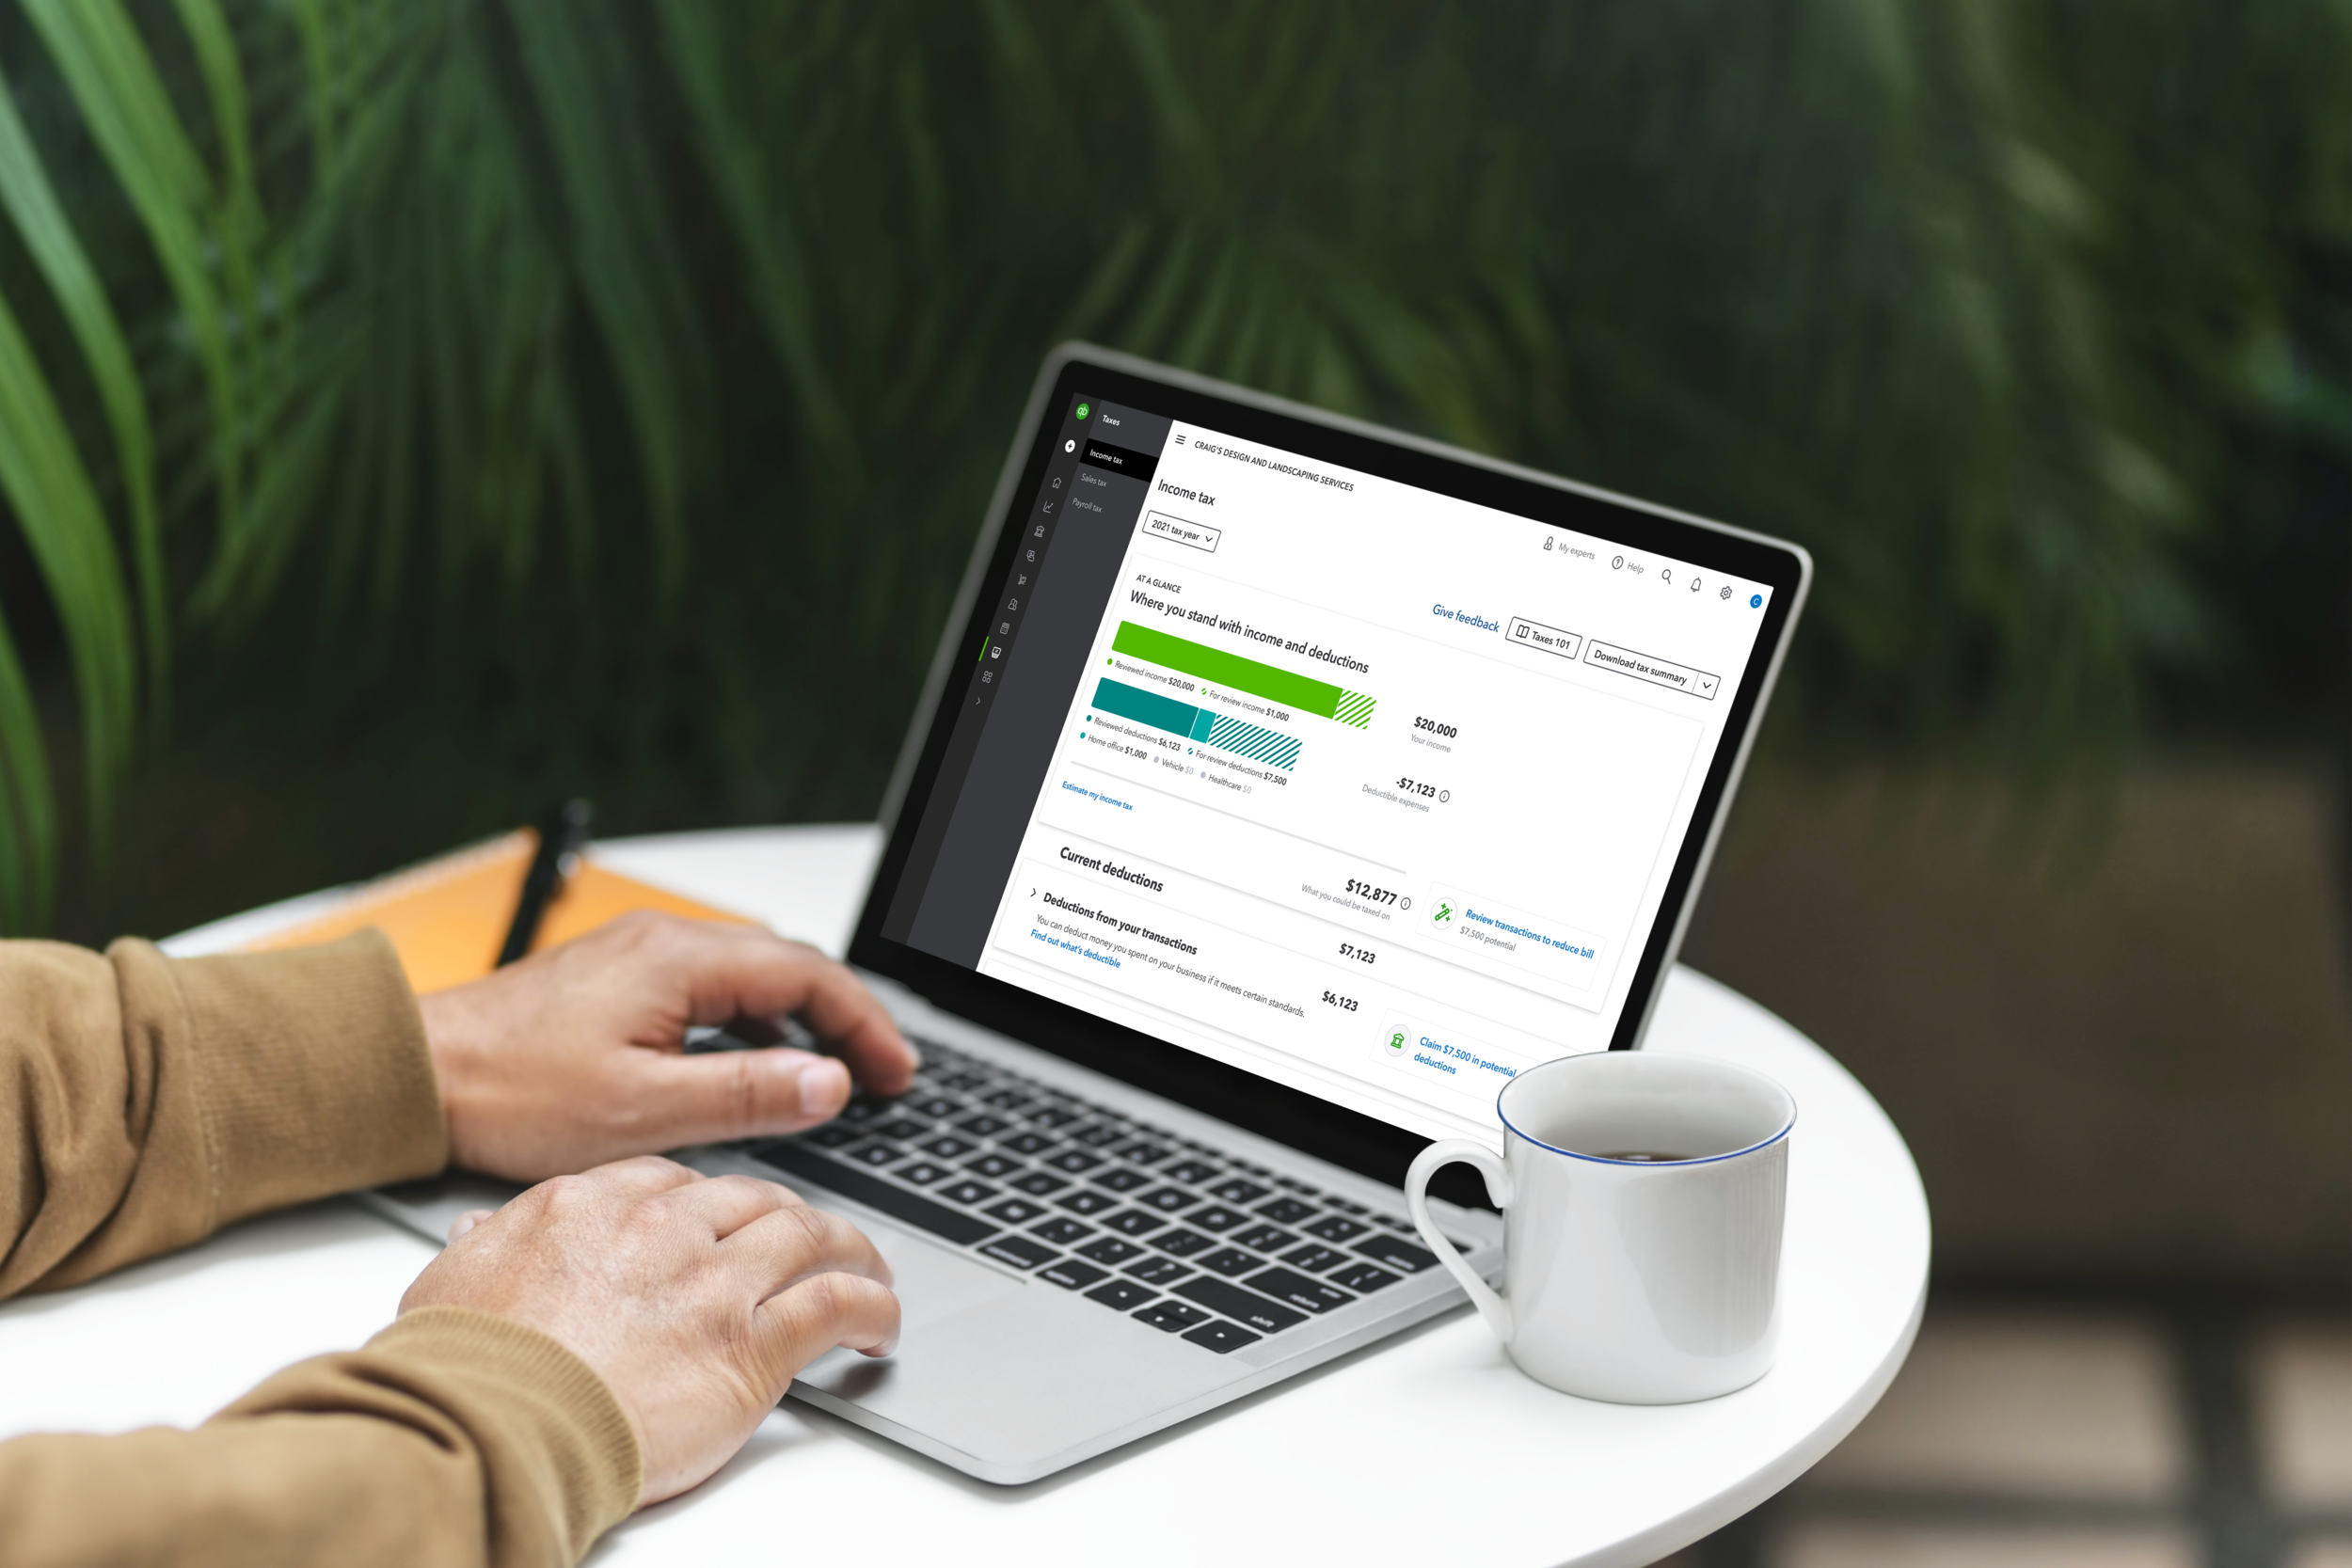
In action.
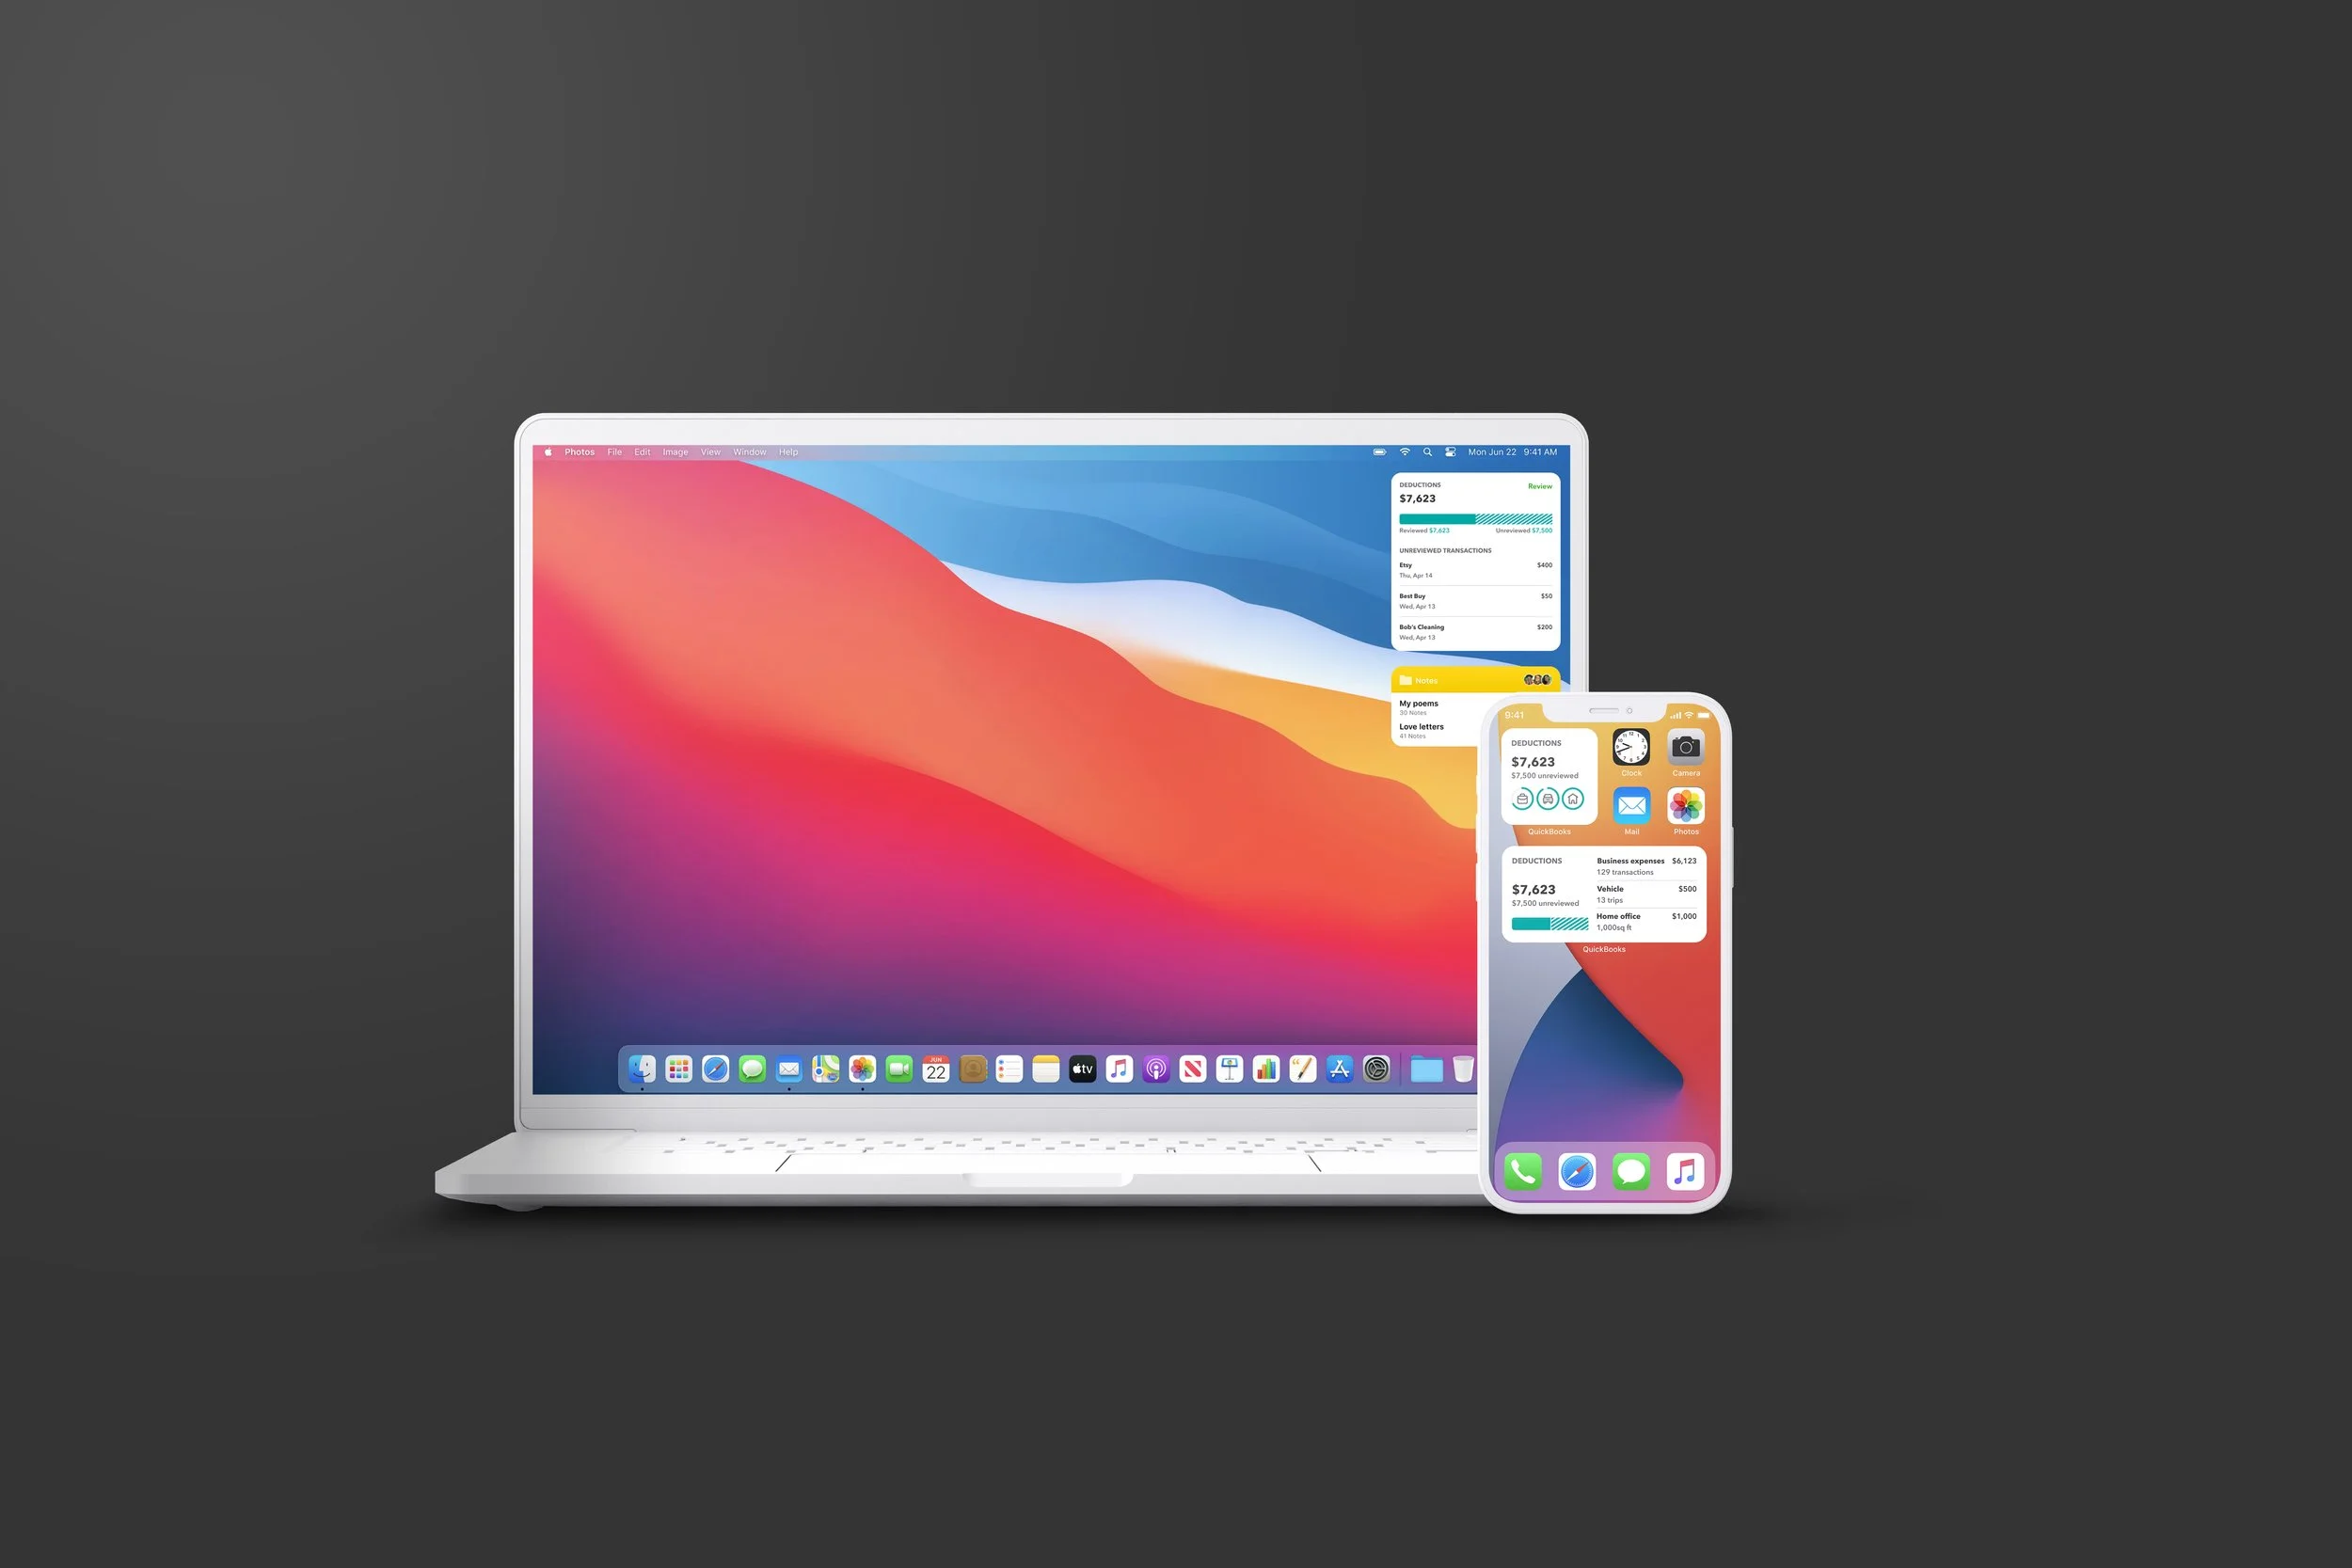
Widgets


Outcome
+915%
On tax day of 2022, the income tax tab was visited 2,904 times. This is a 915% increase in visits when comparing to tax day last year
+11%
Ever since launch in February 2022, there has been an increase of average frequency of visits to the income tax tab of 11%
#1
The tax insight dashboard tile has been outperforming others. Average CTR of income tax tile is 3%, whereas one of the profit & loss tile is 2.42%.

Scalability
Modularize the design for global markets
(WORK IN PROGRESS)